Part 4: The Big Picture
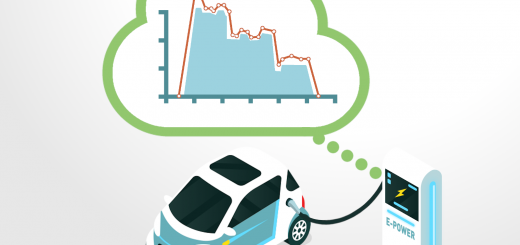
As it has been shown in parts 1-3, Gridware collects events, movement data and measured values. The states of the charging connector and the charging process are derived from those continously.
With this knowledge, Gridware sends notifications to the user and – if desired – takes care of the energy management.
In summary:
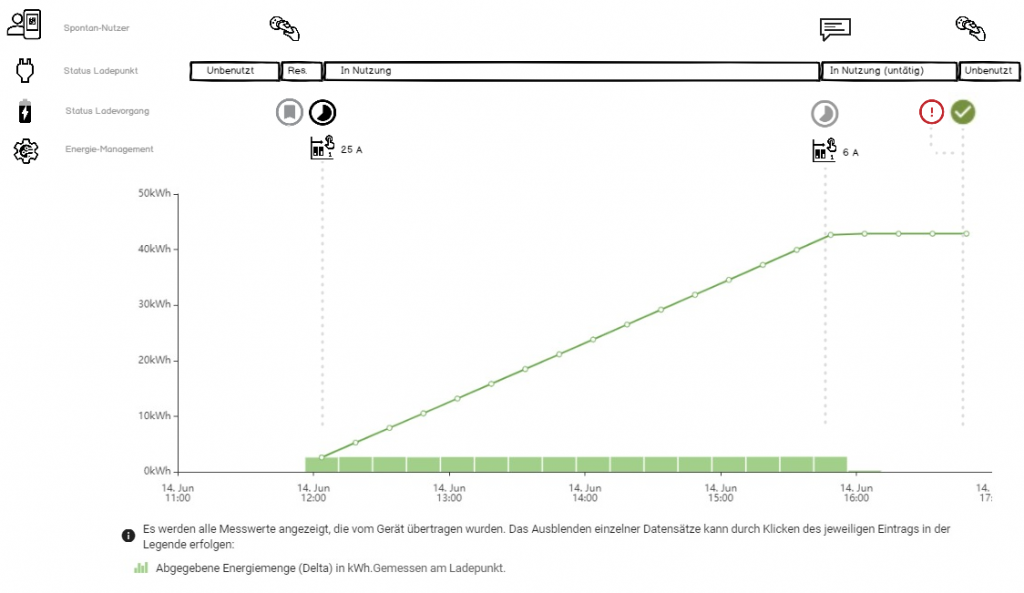
Measured value diagram with annotations for energy management, status of charging connector and charging process as well as user interaction
We have thus systemically analyzed a charging process. But of course there is much more than a single charging process in the system …
A single charging station often has more than just one charging connectors, so that it can be used by several cars at once.
Therefor let us take a closer look of the charging connectors charging station. On that level, Gridware aggregates the usage-state of all charging connectors.
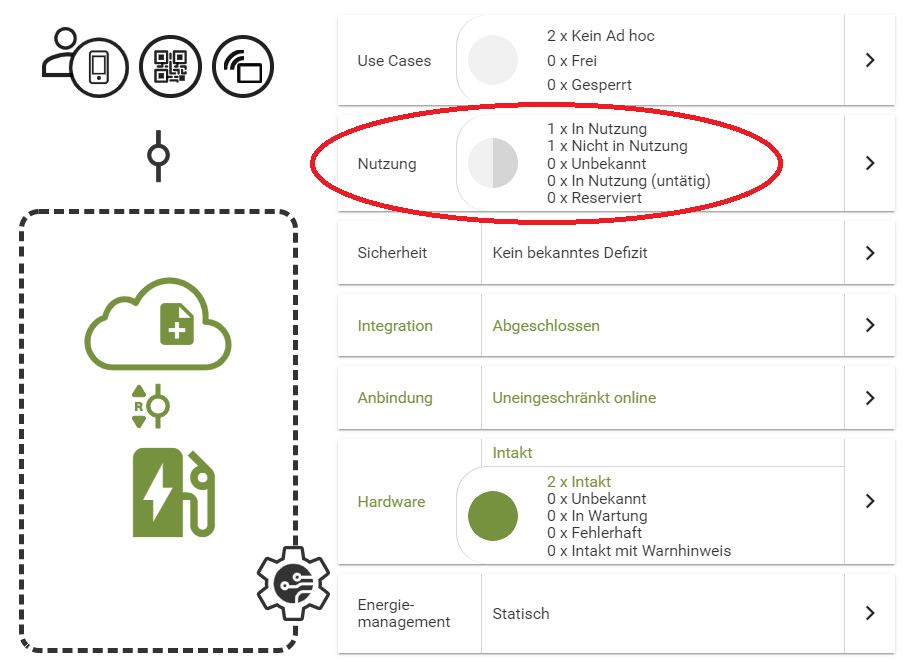
Charging station with two charging connectors. One of them is in use.
Shown here over a longer period of time:
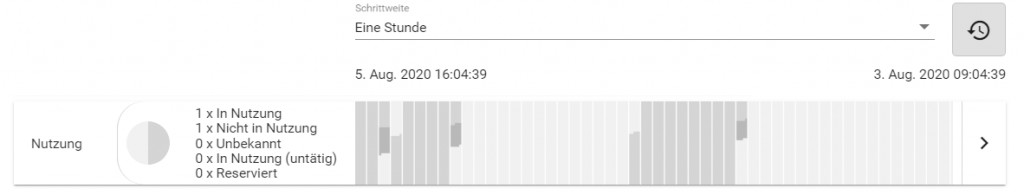
History of the usage state over the course of 2 days and 7 hours
The charging stations are usually set up in groups. These are known as “charging clusters”. An entire parking lot with several such charging clusters is called “charging farm”.
The time period shown above can also be displayed for the charging cluster of the charging station:
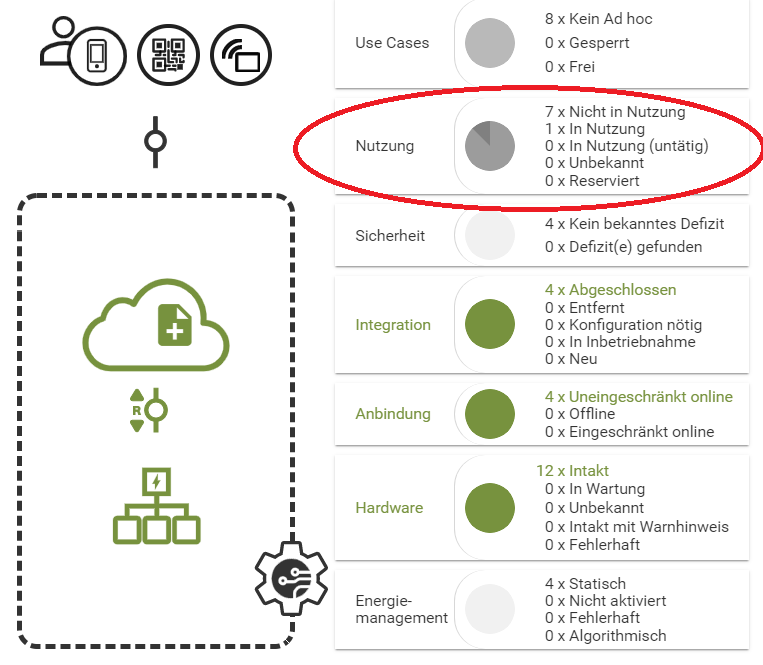
Charging cluster with 4 charging stations and 8 charging connectors, one of which is in use
The higher-level charging farm is displayed in the same way as the the individual charging cluster.
And above those, the areas and regions:
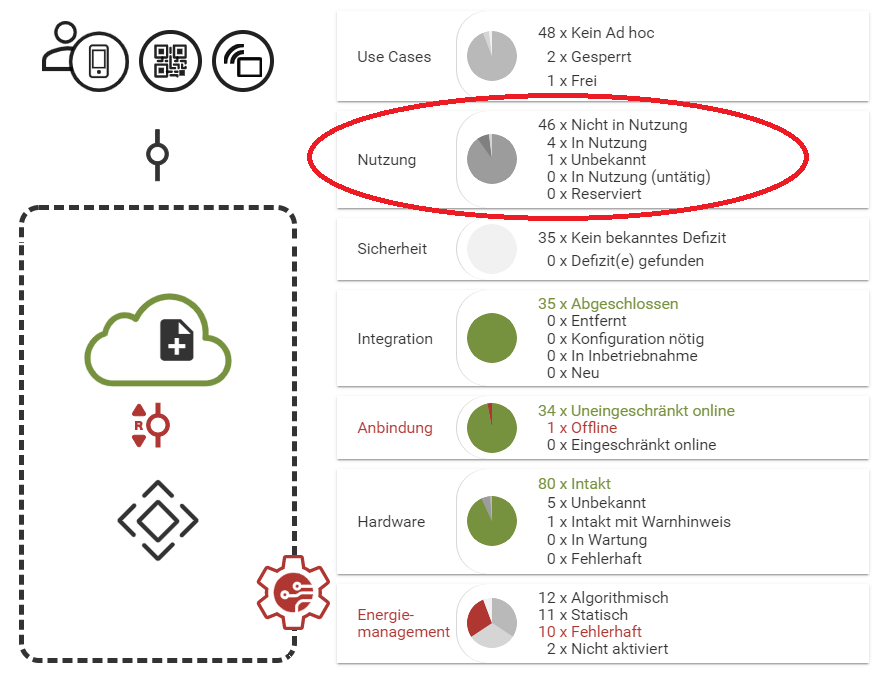
Area with 35 charging stations and 51 charging connectors, 4 of which are in use
All of these representations are intended for the power user who is using the admin portal in order to quickly grasp complex issues in various granularity.
For control stations and control rooms, Gridware also offers the following display for a large display on the wall. It is updated in real time. We call it “wallboard”:
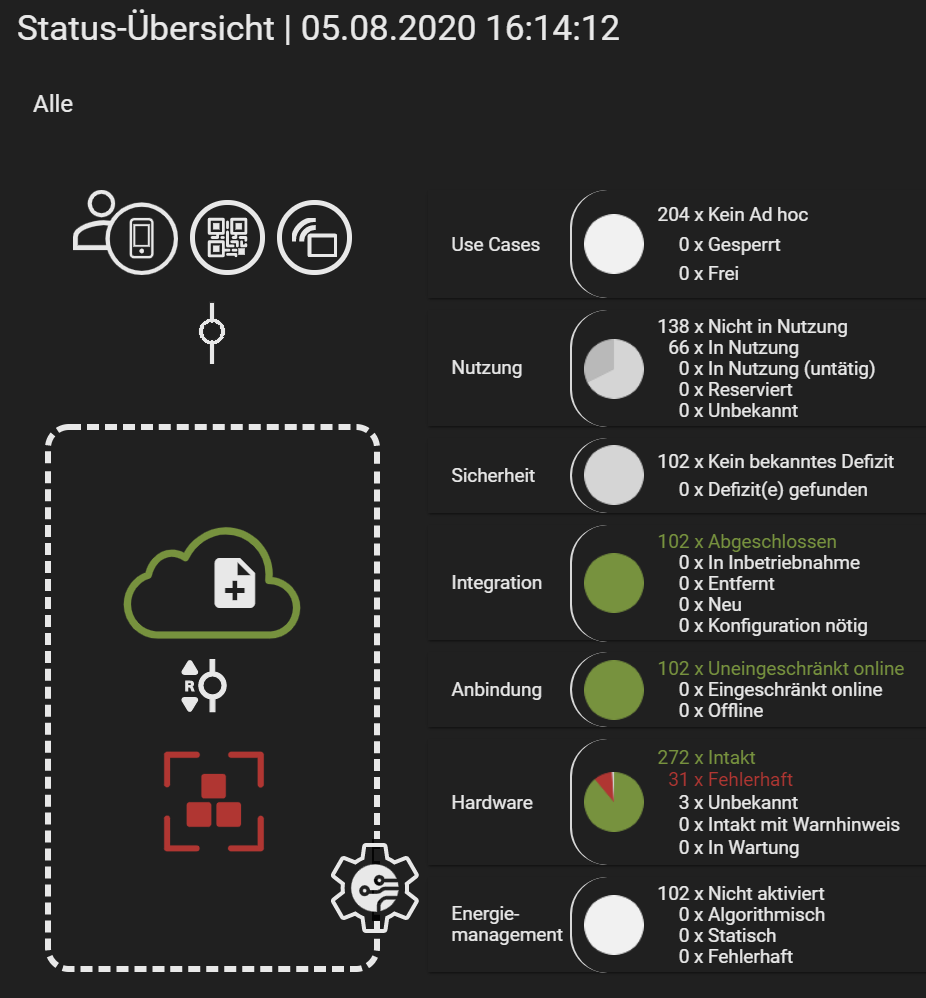
Wallboard is constantly updated, intended for large monitors without a touchscreen
A consistent system is important to us here: from very small to very large, and across all states of a topology.
We’ll discuss these different states in a future post.
With this post we temporarily end our series about the charging process from an IT perspective. We look forward to questions and suggestions!