Part 2: Measured Values
Let us start with the meter reading for the transferred energy in kWh. Each charging station continuously transmits this value at regular intervals:
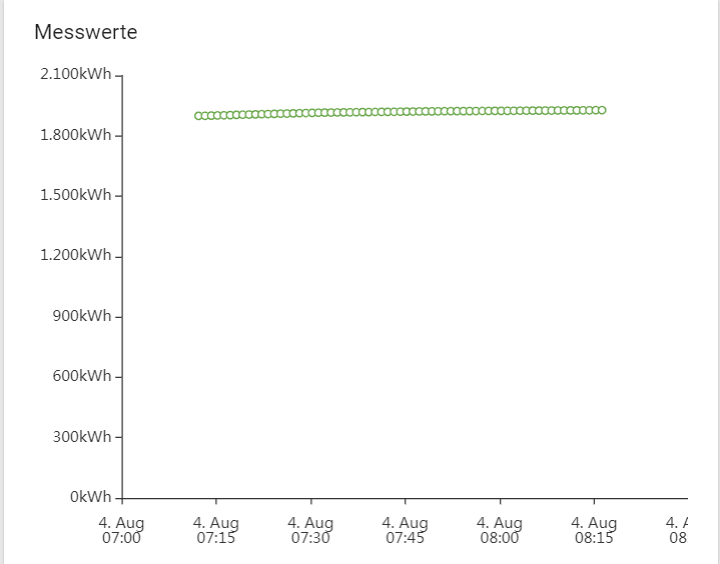
Why is there no nice charging curve to be seen during this charging process of about an hour? Because most charging stations do not reset the value to 0, but instead continuously increase it, ljust like your electricity meter at home.
To better see what is happening here, you can hide the meter reading in Gridware and instead (or additionally) display the energy released in the time interval in kWh on the Y-axis. The same charging process then looks like this:
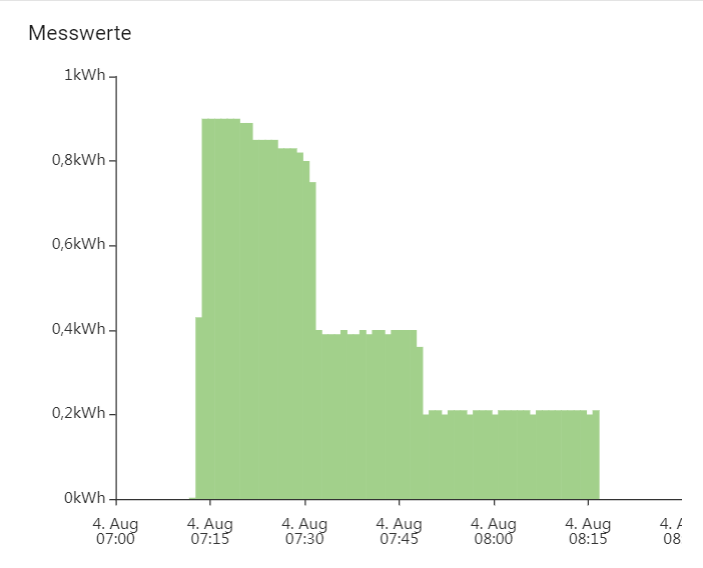
Energy delivered in the period between two transmitted meter readings
If we show the amperage in A and power in kW, we need more Y-axes. But in return we see the wonderful correlations of the values:
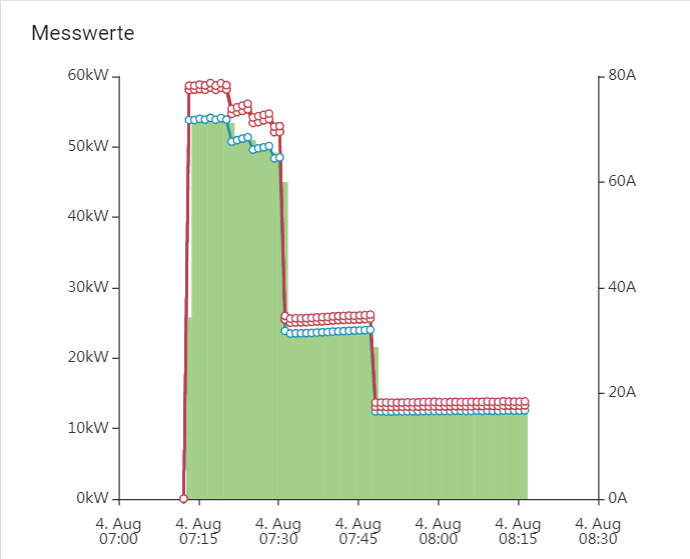
As you can see here, the jumps in the diagram can be explained by a reduced amperage. Apparently the energy management intervened twice:
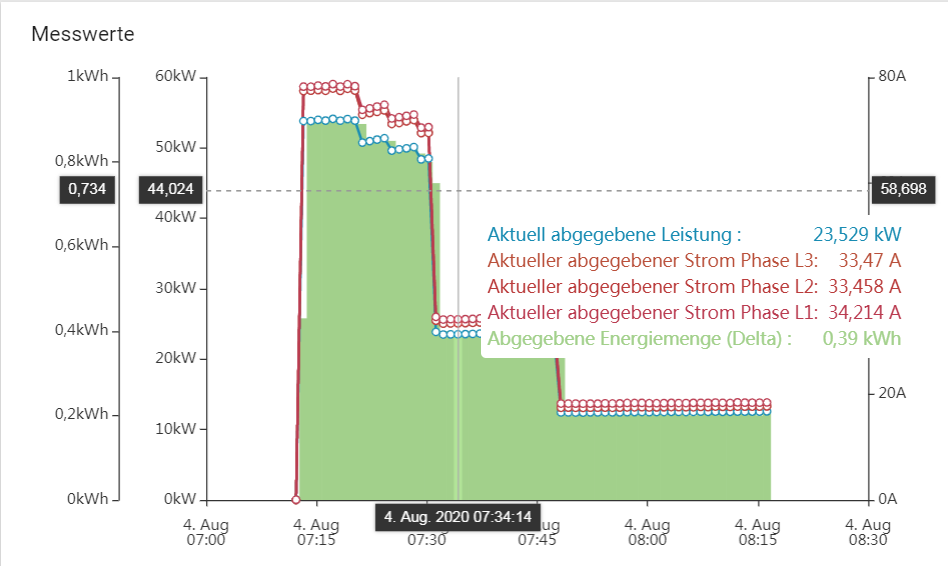
It started at ~ 78A, then turned down to ~ 34A, then turned down to ~ 18 A. Then the user actively ended the charging process at the charging station.
If he would not have done this and the battery had finished being charged due to being at maximum capacity, the battery management system also would have reduced the output. This happens depending on the fill level of the battery, the “State of Charge (SoC)” and the quality of the battery, the “State of Health (SoH)”:
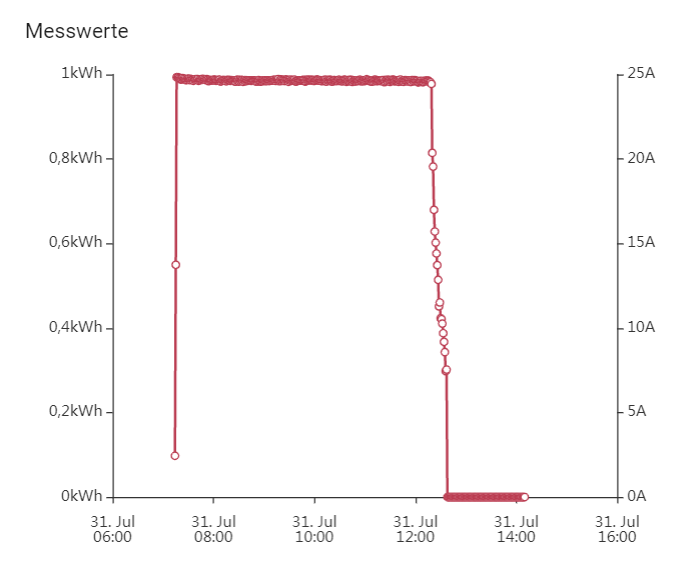
In the example we do not see any intervention by energy management (except the initial upward regulation to 25 A). We see, however, that measured values are still being transmitted, even after the charging process has ended. In the example, the value 0 A is transmitted for approx. 1.5 hours.
This gives an idea of the charging / parking ratio, an important figure for optimizing charging infrastructures. It just gives an “idea”, not solid facts, since after the charging process has ended (in the app or the charging station), the vehicle does not necessarily have to drive away. Nonetheless it is still a good indicator of how long a charging process has been active even while no more electricity had been transmitted.
Finally there are cases like this one:
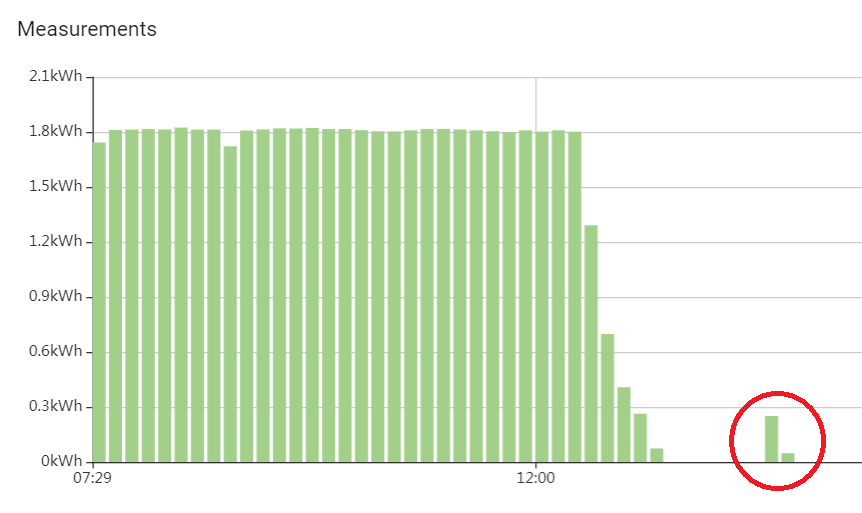
What happened here? The vehicle has obviously decided that it needs more electricity. Typically, the air conditioning did switch on here and the vehicle did not want to unnecessarily discharge the battery.
The Open Charge Point Protocol (OCPP) prior to version 2.0 actually did not provide the possibility to query the State of Charge (SoC). Therefore, Gridware uses other measured values for this purpose, such as the counter reading:
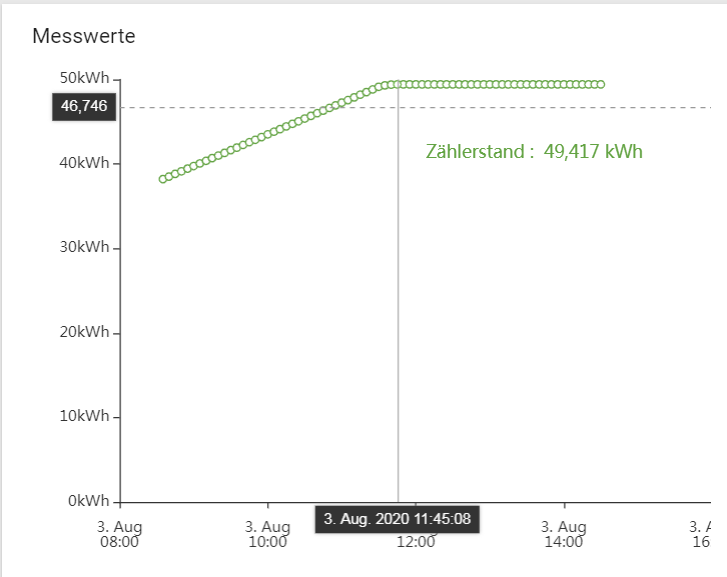
At 11:45 a.m. and 8 seconds a counter reading was reached, which did not change subsequently. Combined with the knowledge that our energy management did not actively intervene here, the assumption that the vehicle actually no longer has an energy requirement is obvious.
The state of the charging process then changes automatically from

ongoing
to

ongoing without energy consumption
and the user will be informed about that.
The other possible states of the charging process will be discussed in Part 3…